Published on 2024-08-08 by Sergey Ivanychev
Simple trick to debug stuck Python jobs
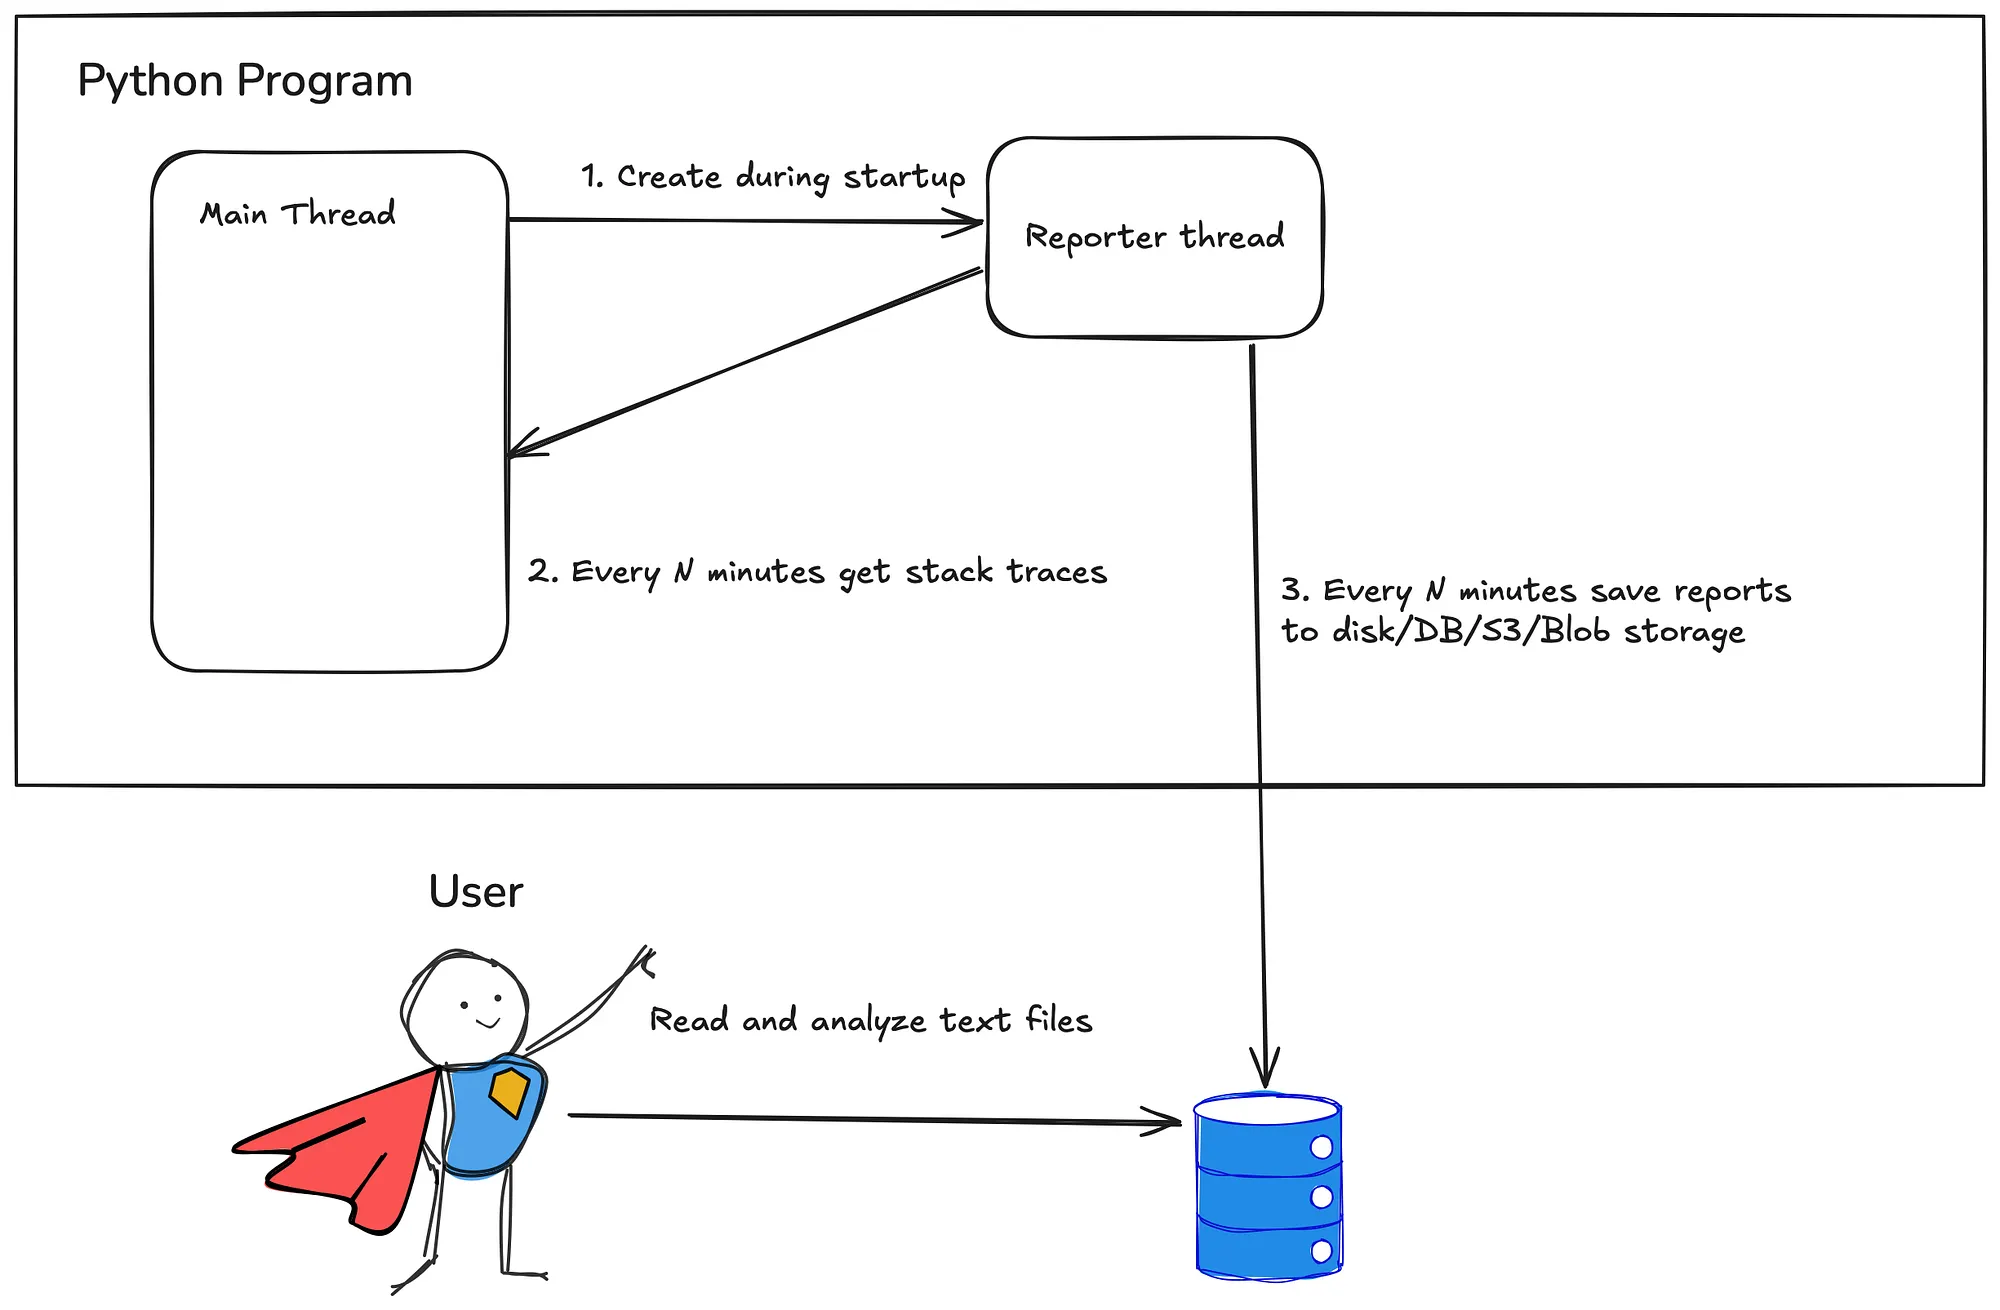
TL;DR: in separate thread run a function that periodically records and saves stack traces of all threads and write them to external storage.

def main():
  # This is where your program starts.
  run_in_thread_and_forget(
    lambda: file_reporter(
      every_seconds=5 * 60,
      output_folder=pathlib.Path('/var/logs/job_id=123')
  ))
Motivation
I work as a data engineering manager that builds a data platform, used internally by ML, Analysts and many other teams. We store petabytes of data, run 5-digit number of pipeline runs per day where performance is very important because we expect to compute results within a day.
We face long running Python jobs, which execute for hours. It’s not rare if your code which was snappy 3 months ago suddenly starts to time out. Sometimes one of data analysts starts to complain that his job doesn’t finish within a day. Maybe you pay too much for GPU machine because all of your computation happens on a single core.
In my work these problems happen to people from time to time and some way to quickly find out where Python code spent too much time is needed.
Requirements
We want to embed some simple mechanism to our Python pipeline that
- No learning curve: When performance degradation happens, the person debugging the problem shouldn’t have to learn a new tool to debug it.
- No performance penalty: This approach has to be enabled on 100% of pipeline runs, because we don’t want to waste a business day to come up with an approach and right profiler to debug the problem.
- Observe in realtime: when the slow program runs, we need to be able to tell what it’s doing.
Idea
It would be great to know what exactly Python code was doing at any point in time after pipeline finished or failed.
This idea crossed minds of many great developers, who already came up with great Python profilers, such as py-spy, cProfiler or austin. I highly recommend using them, when you have physical access to the machine running the code.
We want to avoid using any tool like that, because it brings noticeable slowdown to a program and requires some knowledge to be used.
Integrate sampling code to your job
Getting a string with all stack traces
CPython exposes internal state of the Python process through the standard library, so from within the Python program you can actually inspect all the threads running.
import threading
import traceback
import sys
import io
def render_stack_traces() -> str:
  report = io.StringIO()  # <<< We will write stack traces to here
  for thread in threading.enumerate():
    report.write(str(thread))

    # get current stack frame.
    current_frame = sys._current_frames()[th.ident]
    # render the stack frame as beautifully formatted string.
    traceback.print_stack(current_frame, file=report)

  return report.getvalue()
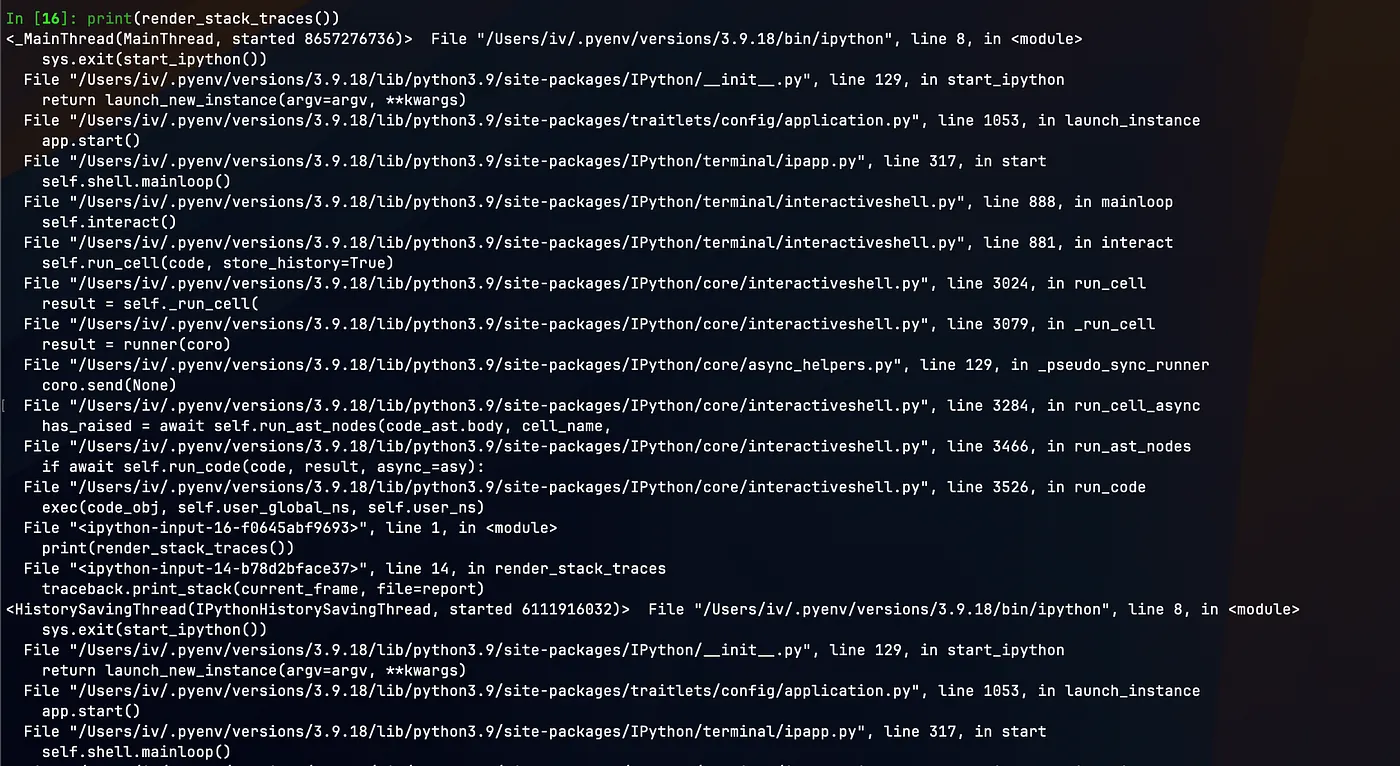
Running print(render_stack_traces()) in my ipython shell shows:

You can see that the function printed the stack trace of exact point where it was called and the contents of a different thread. This simple but powerful technique makes program 80% more observable with 20% of effort because making such reports and saving then every N minutes will help developers to debug what Python program is/was doing during execution.
Schedule the reports in a separate thread
We can’t just call render_stack_traces() in random places of our program, so we need to schedule it in the background. Since it prints all thread information, why not just schedule it in another thread?
import time
import threading
def reporter(every_seconds: int):
  """Infinite loop to render and print reports every N seconds"""
  while True:
    print(render_stack_traces())
    time.sleep(every_seconds)
def run_in_thread_and_forget(func: Callable):
  """Schedule the callable"""
  thread = threading.Thread(
    target=func,
  )
  t.start()
def main():
  # This is where your program starts.
  run_in_thread_and_forget(lambda: reporter(5 * 60))
This program creates a thread, runs the reporter in this thread that every 5 minutes prints the stack traces.
It’s more practical at this point to write the stack reports to some persistance layer (disk, AWS S3, database). Basically, any storage that supports files or long strings will fit. For simplicity, let’s write reports to the file
from datetime import datetime
def file_reporter(every_seconds: int, save_reports_to: pathlib.Path):
  """Infinite loop to render and print reports every N seconds"""
  while True:
    now = datetime.now()
    report = render_stack_traces()
    (save_reports_to / f'st-{now.isoformat()}').write_text(report)
    time.sleep(every_seconds)
def main():
  # This is where your program starts.
  run_in_thread_and_forget(
    lambda: file_reporter(
      5 * 60,
      pathlib.Path('/var/logs/job_id=123')
  ))
That’s all! From this point your program will write X-rays of your program every 5 minutes, which you can use during or after execution to understand what the program was doing.
Write to remote storage + mention it in the logs
You can write the file with report to external file storage available to you and your colleagues. You can also log how to access the reports during the initialization of the program. This will help you and your colleague to quickly catch up, download the reports and see what’s going on. Here I’ll use AWS S3 as an example
from datetime import datetime
import boto3
import os
def s3_reporter(every_seconds: int, bucket: str, prefix: str):
  s3 = boto3.resource('s3')
  while True:
    now = datetime.now()
    report = render_stack_traces()

    # Write the report to S3.
    key = os.path.join(prefix, f'st-{now.isoformat()}')
    obj = s3.Object(bucket, key)
    obj.put(Body=report.encode('utf8')
    time.sleep(every_seconds)
def main():
  # This is where your program starts.
  bucket = 'your-bucket'
  prefix = 'reports/job=123'

  # Communicate how to download and read logs:
  print(f'''
  The stack traces are written to s3://{bucket}/{prefix}
  You can use the following command to download
  reports to your computer and read them:
  `aws s3 sync s3://{bucket}/{prefix} reports`
  ''')
  run_in_thread_and_forget(
    lambda: s3_reporter(
      5 * 60,
      bucket,
      prefix
  ))
Conclusion
In this article I presented a simple yet effective way to observe long-running Python programs. The approach has
- No learning curve: Every Python developer is familiar with stack traces from the first day of coding.
- No performance penalty: The thread that creates reports sleeps for minutes before getting a stack trace and writing to the destination.
- Observe in realtime: you can observe the output folder during execution and read the fresh stack traces.