Published on 2023-11-29 by Sergey Ivanychev
Observe and record performance of Spark jobs with Victoria Metrics

In this article, we will explore our approach to monitoring and observability of performance of Spark pipelines. We’ll describe our approach to building the system with Databricks clusters, but the technique can be applied to any Spark setup. Our requirements for the systems were:
-
Be able to inspect metrics in real-time
-
Be able to inspect metrics after the cluster shutdown
-
Automate the performance insights generation using collected metrics
-
Be able to push metrics from driver and workers (because we can’t pull metrics from them with Prometheus)
The article is divided into three sections:
-
Background section describes the existing approaches for monitoring.
-
Making Spark pipelines observable section describes the chosen approach on high-level.
-
Using performance metrics in action section describes the concrete details used in our monitoring systems.
Background
At Constructor, multiple teams use data platforms to build data pipelines and process terabytes of data every day. The data platform team is responsible for providing tools for other teams to effectively do it. Each team owns dozens of different pipelines.
We care about pipeline performance because it inevitably influences the overall cloud bill and time of execution. Bad performance can lead to pipeline failures or to a disproportional increase of its execution time (e.g., when too much RAM is used and swap is used).
So, we need to observe performance, but we can’t afford to manually check in on every pipeline. There are too many pipeline runs happening daily (in our case, ~10k in total). Thus, we need to build an automated way to collect performance metrics from Databricks, store them for later inspection, and build a tool on top of this data to gather performance insights. Some of the requirements for the monitoring system are:
-
Metrics should be stored and readable by both human and machine. We would like to look at the metrics in real-time during the pipeline run. Also, we want to be able to examine them after it finishes. We also want to process them and get insights.
-
Metrics should be pushed from driver/executors. Our pipelines use Databricks Container Services. So, we’re very limited with what we can expose from the container running Spark. The vanilla Prometheus way of pulling metrics won’t work for us.
The state of Spark performance observability
The most important metrics exposed by Spark are represented in **Spark Web UI. It provides a lot of information about Spark job execution and metrics, such as GC time, time to serialize/fetch results, peak execution memory, and shuffle read/write sizes. Most of these metrics are Spark specific and aggregated over a period of time.**
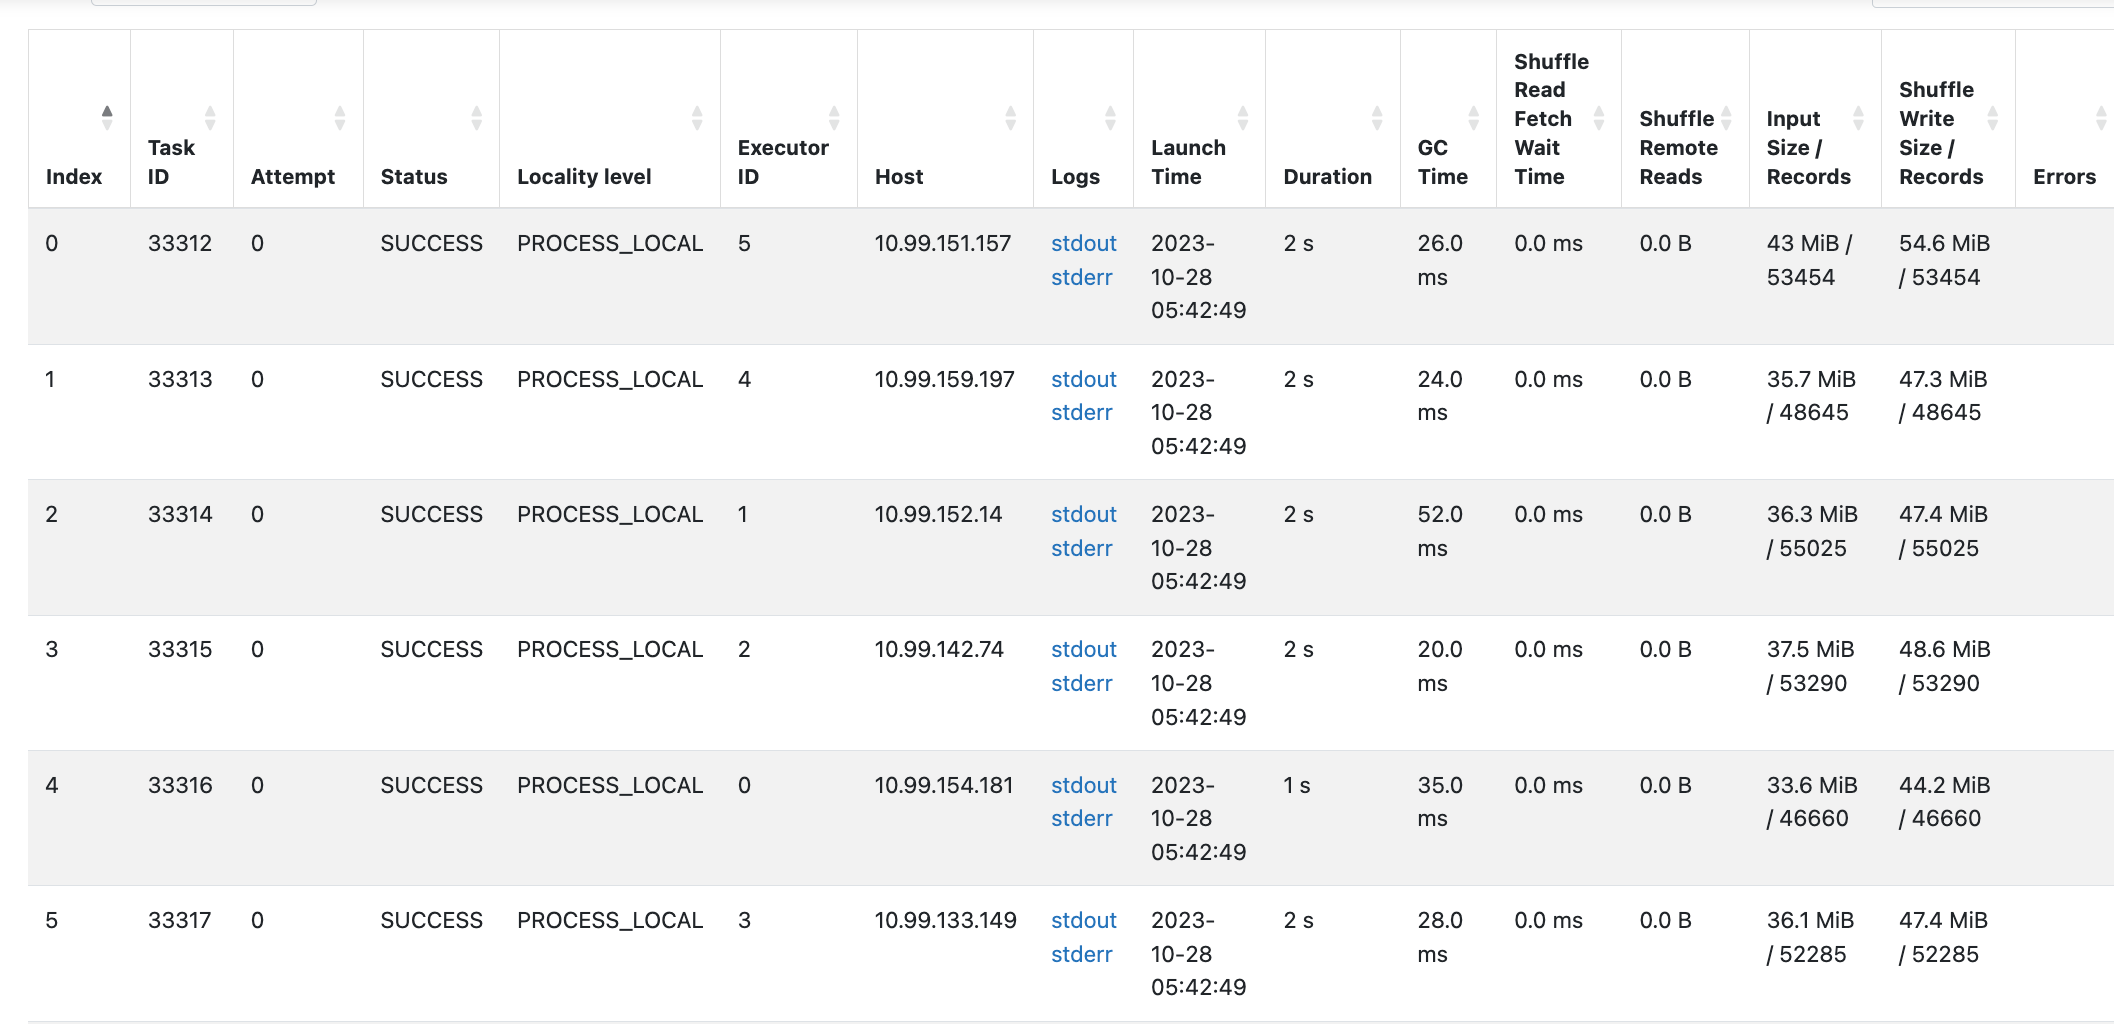
These metrics can be gathered automatically using a built-in Spark prometheus integration. This can be enabled with setting spark.ui.prometheus.enabled=true. The metrics will be exposed in Prometheus format at /metrics/executors/prometheus path.
- If you’re using Databricks, you can use the following URL format to access them:
https://dbc-<instance>.cloud.databricks.com/?o=...#setting/sparkui/<cluster_id>/driver-.../metrics/executors/prometheus
- I’m not aware of how to fetch these metrics in plain text. Feel free to comment on this article if you know if these are exposed.
The problem with these metrics is that it does not expose any time series information and detailed performance metrics like CPU time breakdown, IOPS, etc. Moreover, the data that is exposed by UI is inconvenient to extract automatically to make it queryable.
Before the Databricks Runtime 13.0
Ganglia was the main performance observability solution for Apache Spark prior to the DBR 13.0 version. It exposed the performance metrics in a separate webpage, letting a user query what’s curious to them.
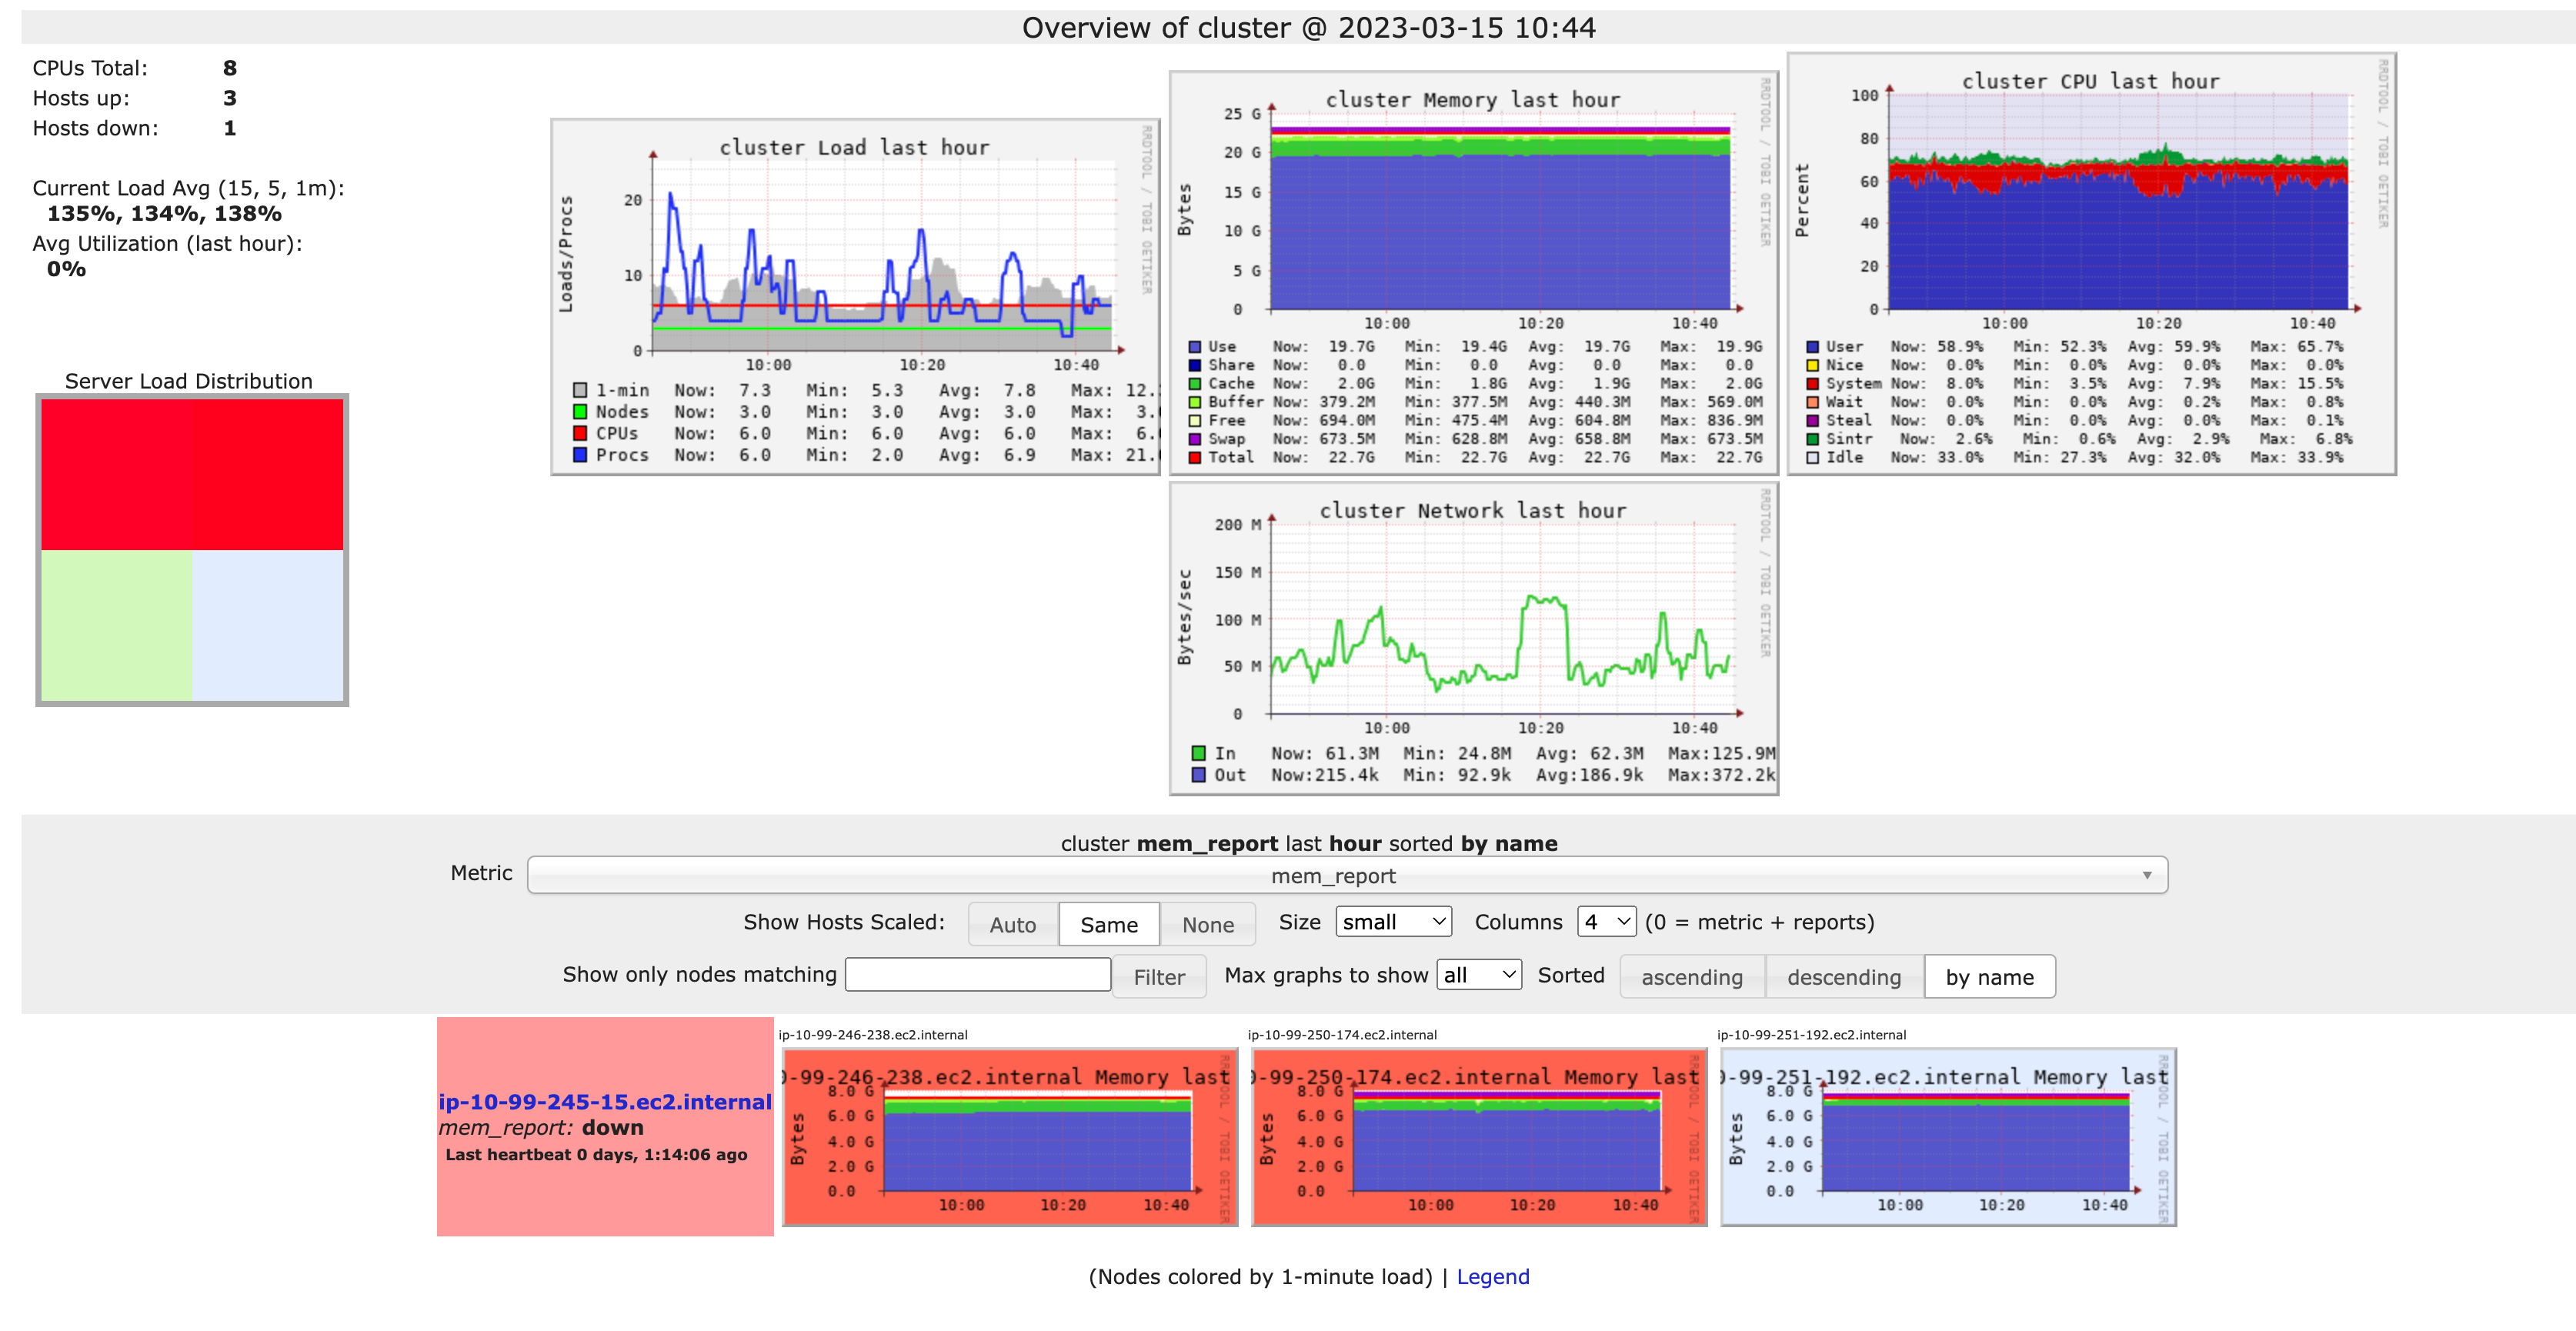
The biggest problem with Ganglia is as soon as the cluster dies, Databricks only has a collection of screenshots of metrics taken with a 15-minute interval. These screenshots are sometimes helpful, but can’t provide a detailed picture of what’s going on.
In addition, Ganglia is not developed and not supported on modern operating systems (e.g., you can’t install it via apt since Ubuntu 20.04).
Databricks Runtime 13.0 and later
Starting from DBR 13.0, Databricks replaced Ganglia with cluster metrics.

Compared to Ganglia, it’s capable of storing live and historical cluster metrics and exposing them through Databricks UI.
This system greatly improves observability, but still is not good enough to build monitoring upon. This performance data is not exposed via any API. This means no alerts or Grafana dashboards.
Making Spark pipelines observable
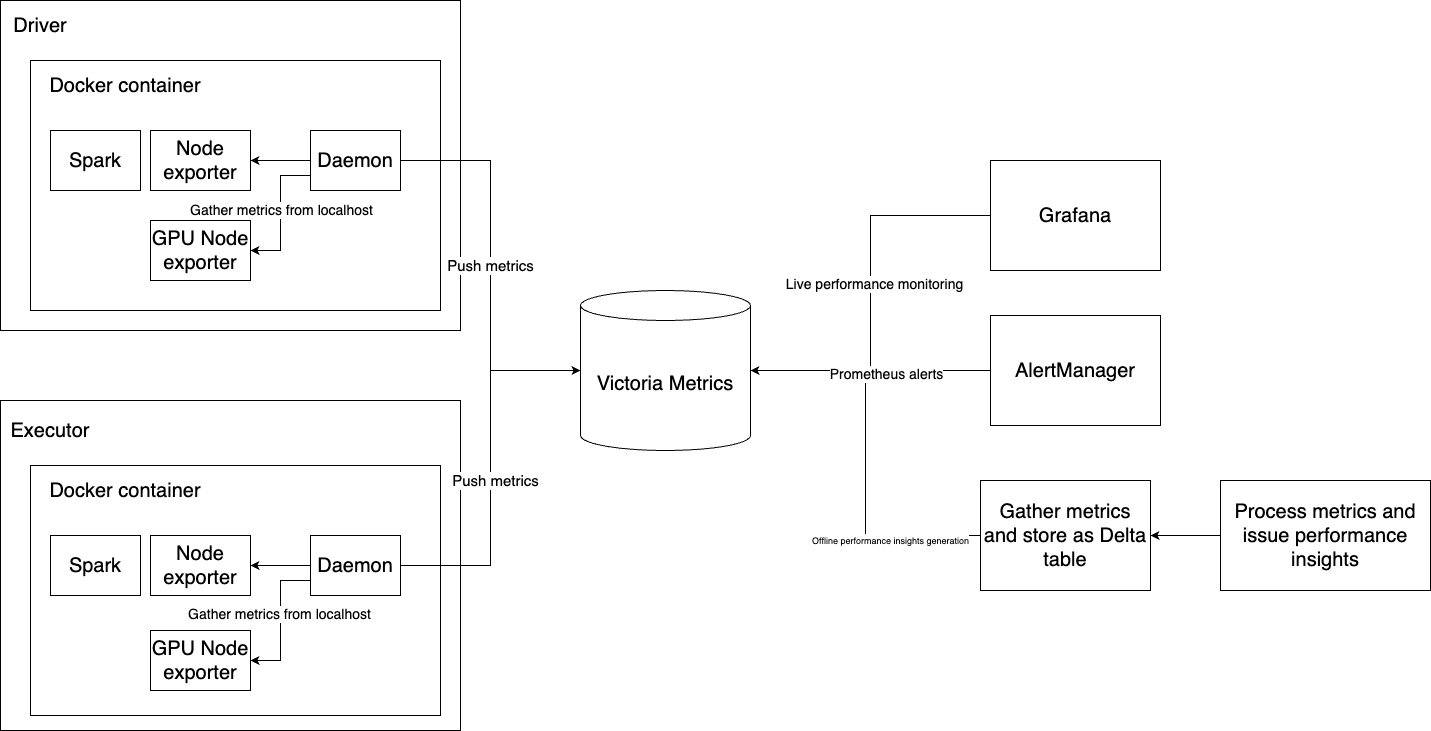
Here’s the solution we came up with:
-
Deploy a container with Victoria Metrics accessible within our infrastructure.
-
During initialization time (init script), we install node_exporter, nvidia_gpu_exporter and run them in the background. They collect performance metrics and expose them locally.
-
During initialization time, we run a Python script in the background that periodically pulls metrics from node exporters and pushes them to Victoria Metrics.
-
Connect Grafana to it as a Prometheus source. Create AlertManager based on the Prometheus source. Periodically gather all metrics, store them as a Delta table, and automatically find performance problems.
Victoria metrics
Victoria Metrics is a fast, cost-effective, and scalable monitoring solution and time series database. It is developed in Go, Prometheus-compatible, and supports both pulling metrics from targets (as Prometheus) and pushing metrics to it via an API. It also supports PromQL and can serve as a Prometheus-source for Grafana.
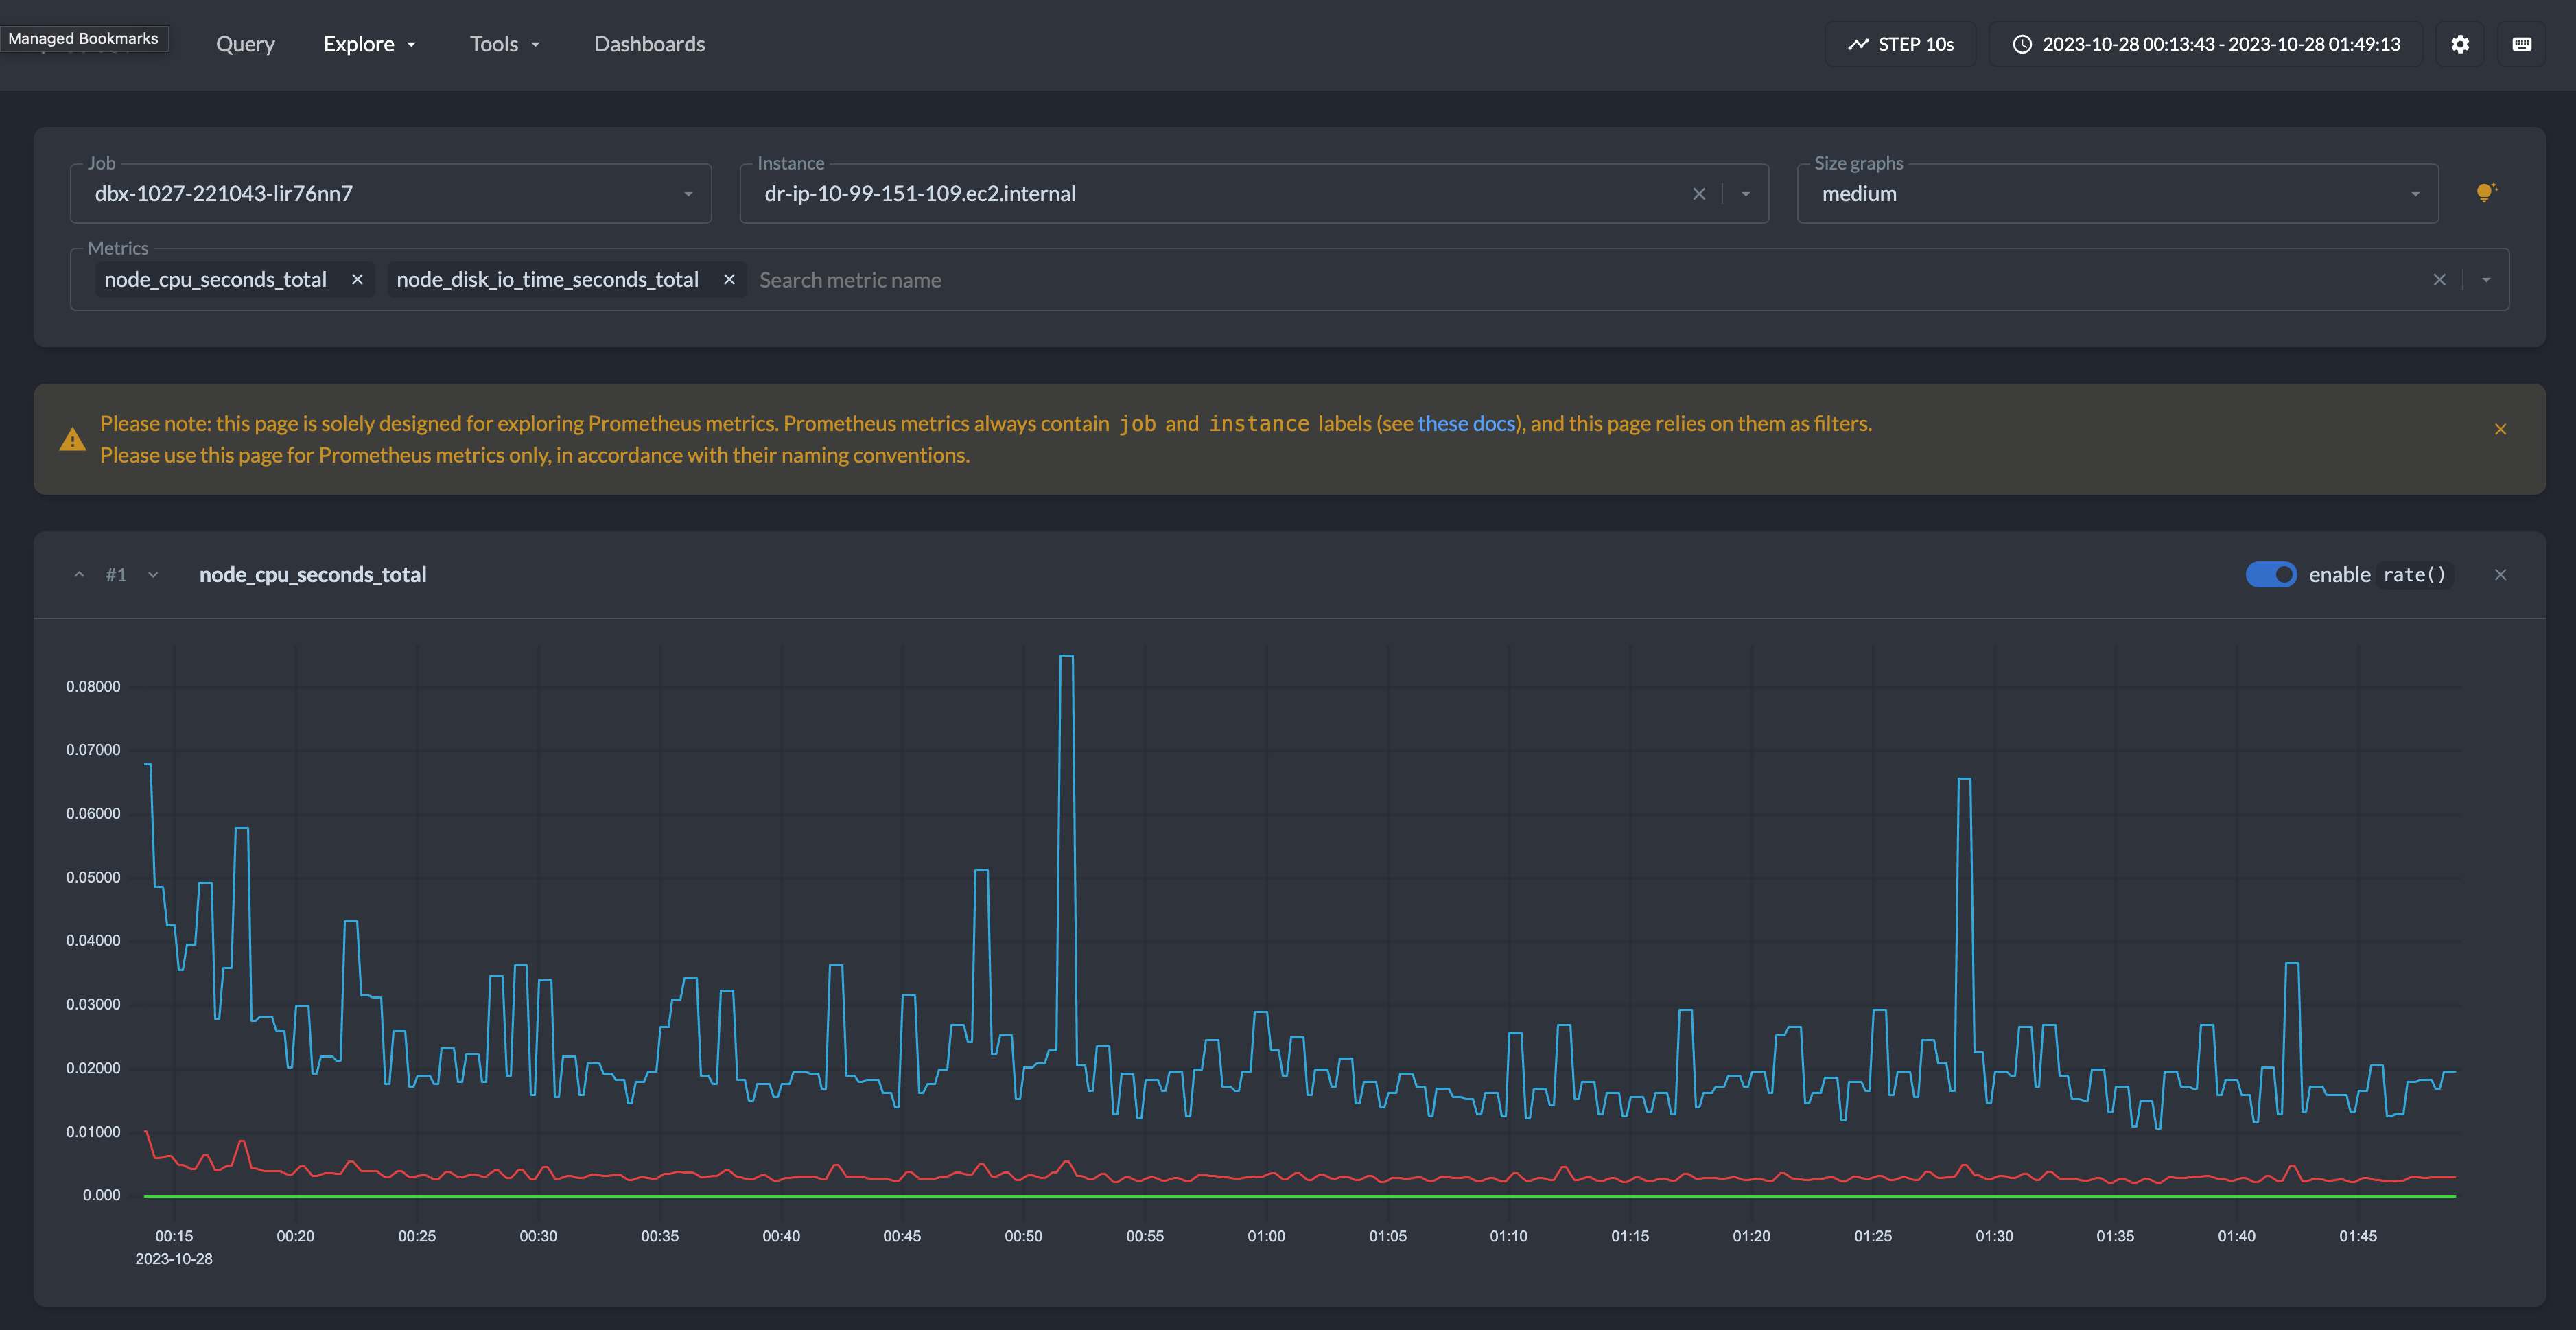
Victoria Metrics can be deployed easily in any environment, which can run Docker containers (ECS in our case).
docker run -it - rm \
  -v /where/to/store/data/locally:/victoria-metrics-data \
  -p 8428:8428 \
  victoriametrics/victoria-metrics \
  -retentionPeriod=1w
Two things to highlight:
-
Mount the local folder to /victoria-metrics-data to specify where the VM data will be stored
-
--retentionPeriod=1w controls how many days the metrics will be stored by VM. After the period, these will be cleaned up automatically.
Victoria metrics exposes data in multiple ways:
-
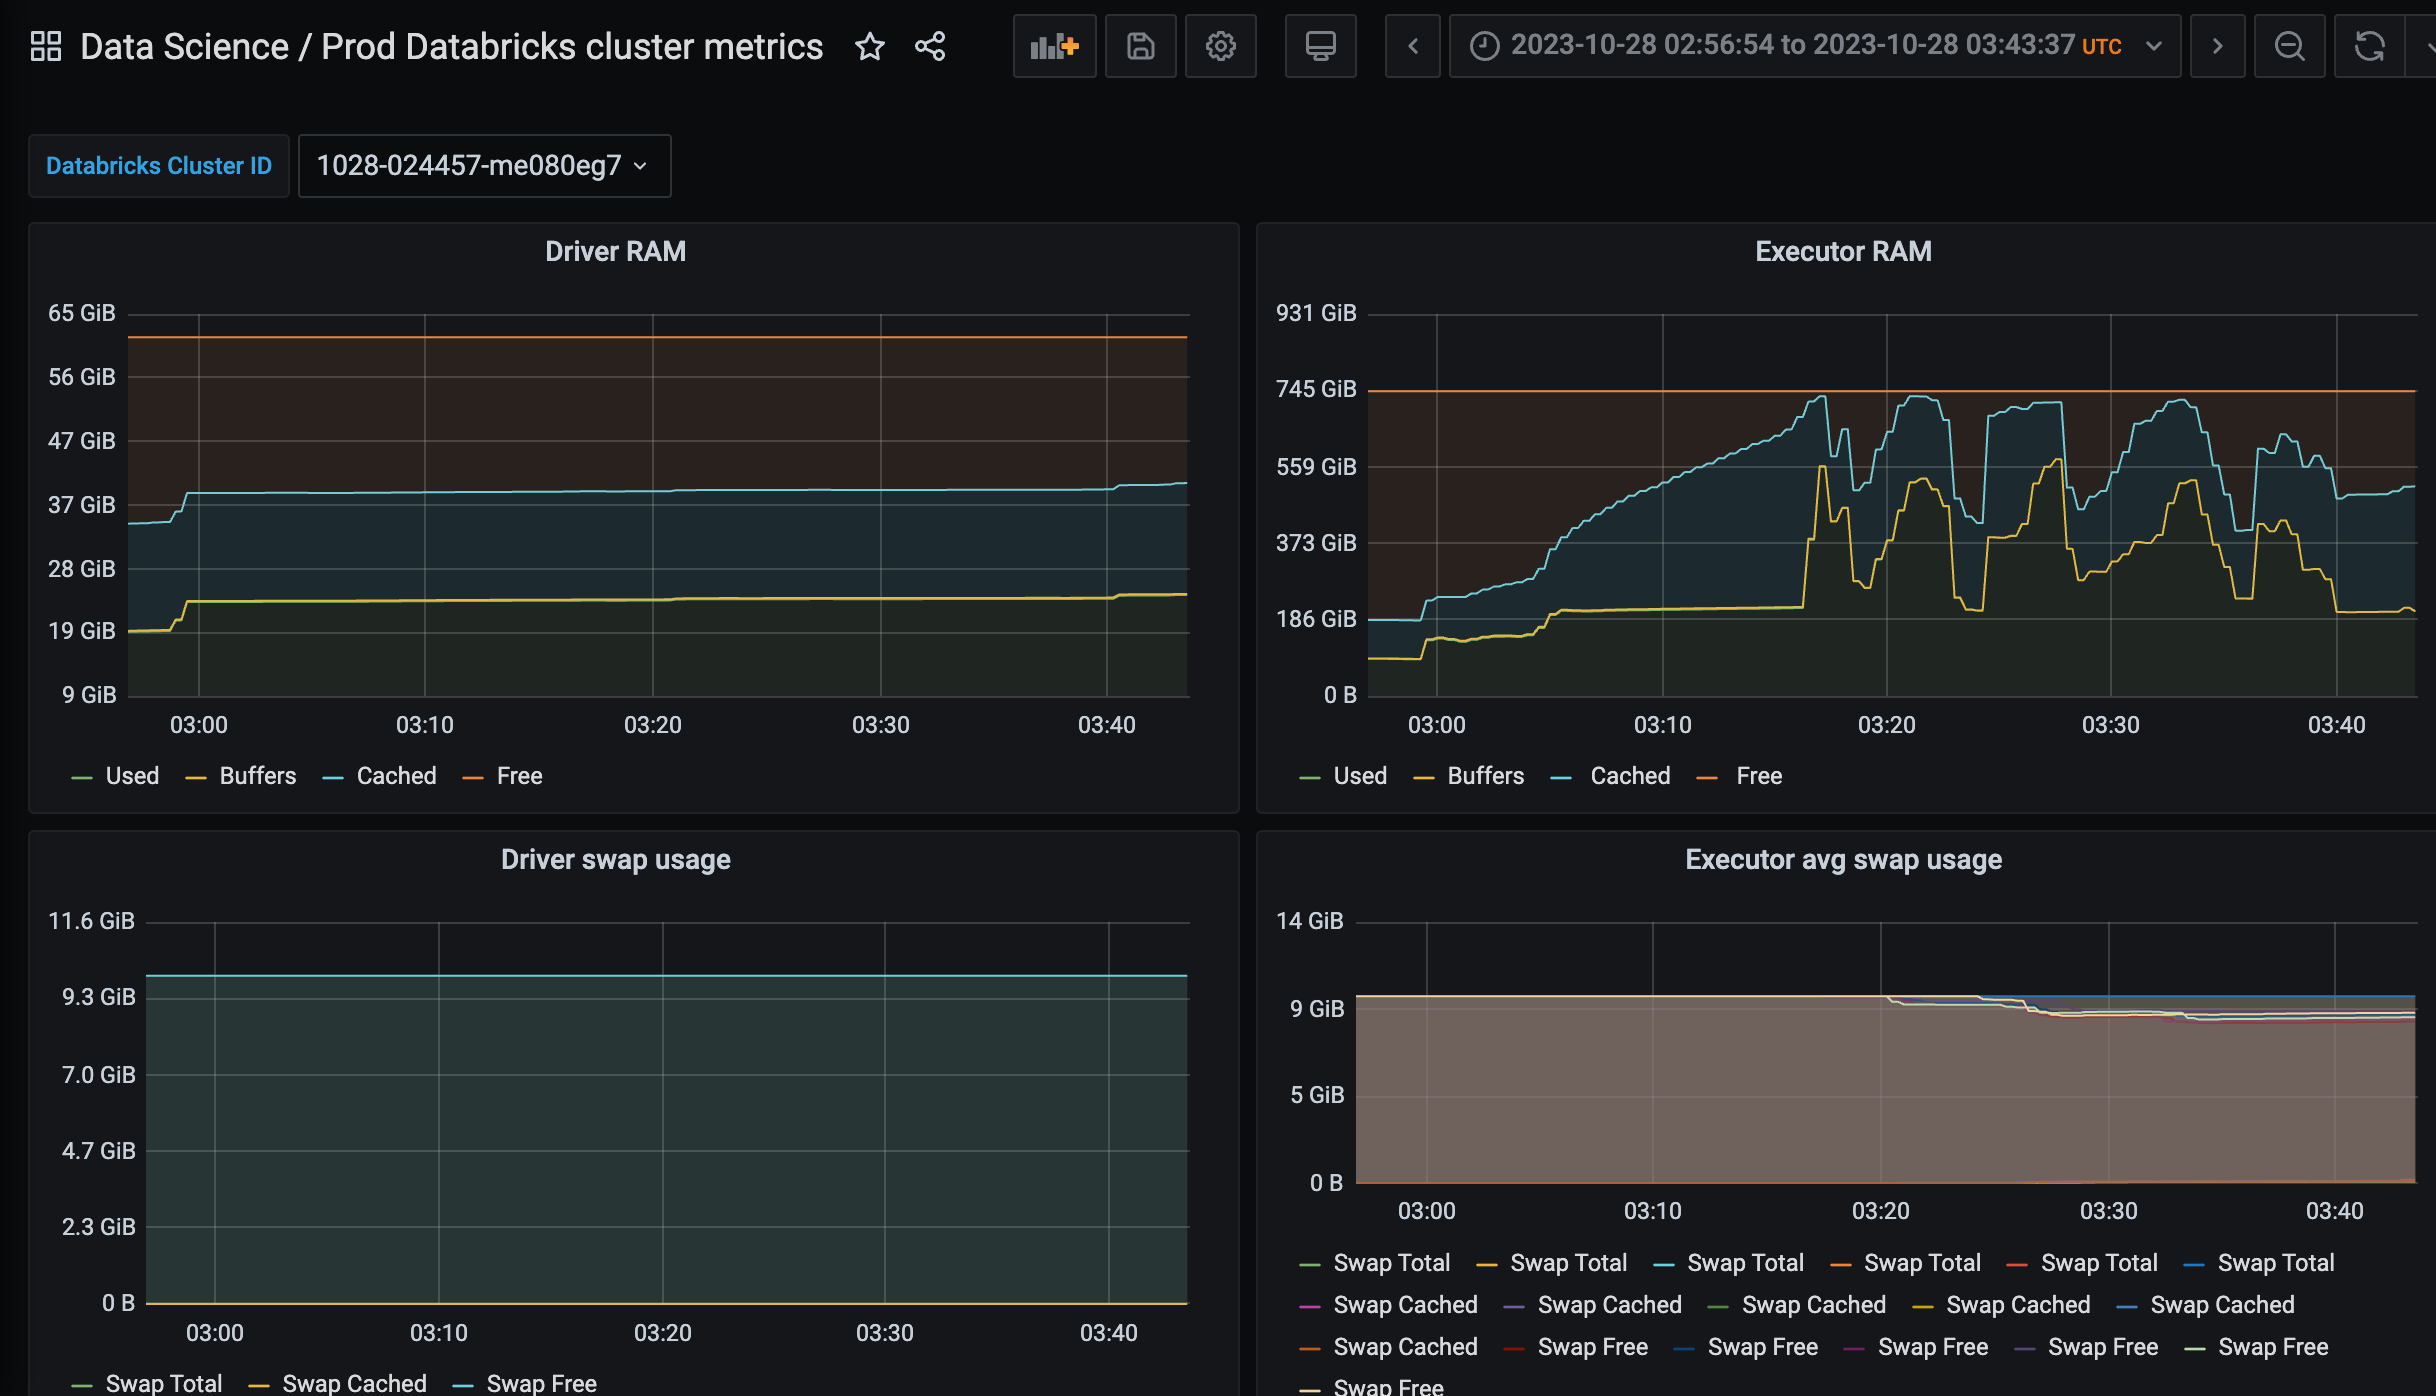
You can use VM as Prometheus sources in Grafana and use PromQL to describe data requests.
-
You can use Victoria Metrics API to fetch data in CSV, JSON, and native formats for further processing. Here’s the example of how to download these metrics in JSON format from Python:
response = requests.get(
  url="https://localhost:8428/api/v1/export",
  params={
    "match[]": "{job=\"job-id\"}",
  },
)
Node exporter and Nvidia GPU exporter
node_exporter collects various system metrics, such as CPU, disk I/O, memory, network, etc., and exposes them via API in Prometheus format. nvidia_gpu_exporter does the same and exposes metrics in the same format, but only cares about GPU metrics. Example of metrics in this format:
node_disk_read_bytes_total{device="disk0"} 2.89638715392e+11
node_disk_read_errors_total{device="disk0"} 0
node_disk_read_retries_total{device="disk0"} 0
node_disk_read_sectors_total{device="disk0"} 4616.966796875
node_disk_read_time_seconds_total{device="disk0"} 4674.995333666
Remember that Victoria Metrics supports pulling and pushing metrics in Prometheus format. Thus, we need something in between them. Running them during init time of the container is as easy as:
nohup node_exporter &
nohup nvidia_gpu_exporter &
Metric collection daemon
You need to implement a program that pulls metrics from node exporters and pushes them to Victoria Metrics in 30 seconds. In the simplest form, it can be something like this (implemented in Python):
import requests as r
import time

while True:
    # Export metrics every 30 seconds.
    time.sleep(30)
    # Fetch node exporter metrics from local node_exporter.
    node_resp = r.get('http://127.0.0.1:9835').text
    # Fetch GPU metrics from local nvidia_gpu_exporter.
    node_gpu_resp = r.get('http://127.0.0.1:9100').text
    # Combine metrics and send them to Victoria Metrics.
    all_metrics = '\n'.join((node_resp, node_gpu_resp))
    r.post('http://victoria-metrics-url/metrics/job/my-job-id/instance/my-instance-id',
           body=all_metrics)
Note that the URL to Victoria metrics contains all labels assigned during upload. In the example above, two labels will be assigned to the metrics: job=my-job-id and instance=my-instance-id . This is the place where you can add needed labels, such as Databricks cluster id, instance IP, instance type, pipeline name, owner team, etc. To run this in the background of the driver/executor container, use nohup
# Forward stdout and stderr to files.
nohup python dbx_daemon.py > /tmp/dbx_daemon.log 2> /tmp/dbx_daemon.err &
Using performance metrics in action
During the cluster initialization time, we save and later expose the following labels from driver and executors. Note that we use initialization time environment variables and metadata from EC2 instance metadata IP (169.254.169.254)
-
is_driver— is the current instance Spark driver or not. This information is available via DB_IS_DRIVER environment variable, available during cluster initialization (in init script). -
job— main Victoria Metrics label. We use the Databricks Cluster ID for that. Available at DB_CLUSTER_ID environment variable during initialization. -
instance_type— AWS EC2 instance type. Available on board of EC2 instance at 169.254.169.254/latest/meta-data/instance-type -
instance_lifecycle— is the instance Spot or On-Demand. 169.254.169.254/latest/meta-data/instance-life-cycle -
instance_region,instance_az,instance_hostname— these are available at 169.254.169.254 as well.
VM system requirements
Regarding the needed resources for the Victoria Metrics setup, we currently store:
-
32,218,411 total time series
-
With 6 labels with >10K of unique values each daily
-
Running in container with 1 CPU core, 4G of RAM, and 100G of disk storage
Real-time performance dashboard
In Grafana, add a Prometheus data source and use Victoria Metrics URL for that. It will work. Using this data source, it’s straightforward to create a dashboard parameterized with job (label of metrics pushed to VM).
Using a concrete job value, we can fetch and aggregate all the metrics we need from VM in Grafana. (This is the full example of our dashboard.)
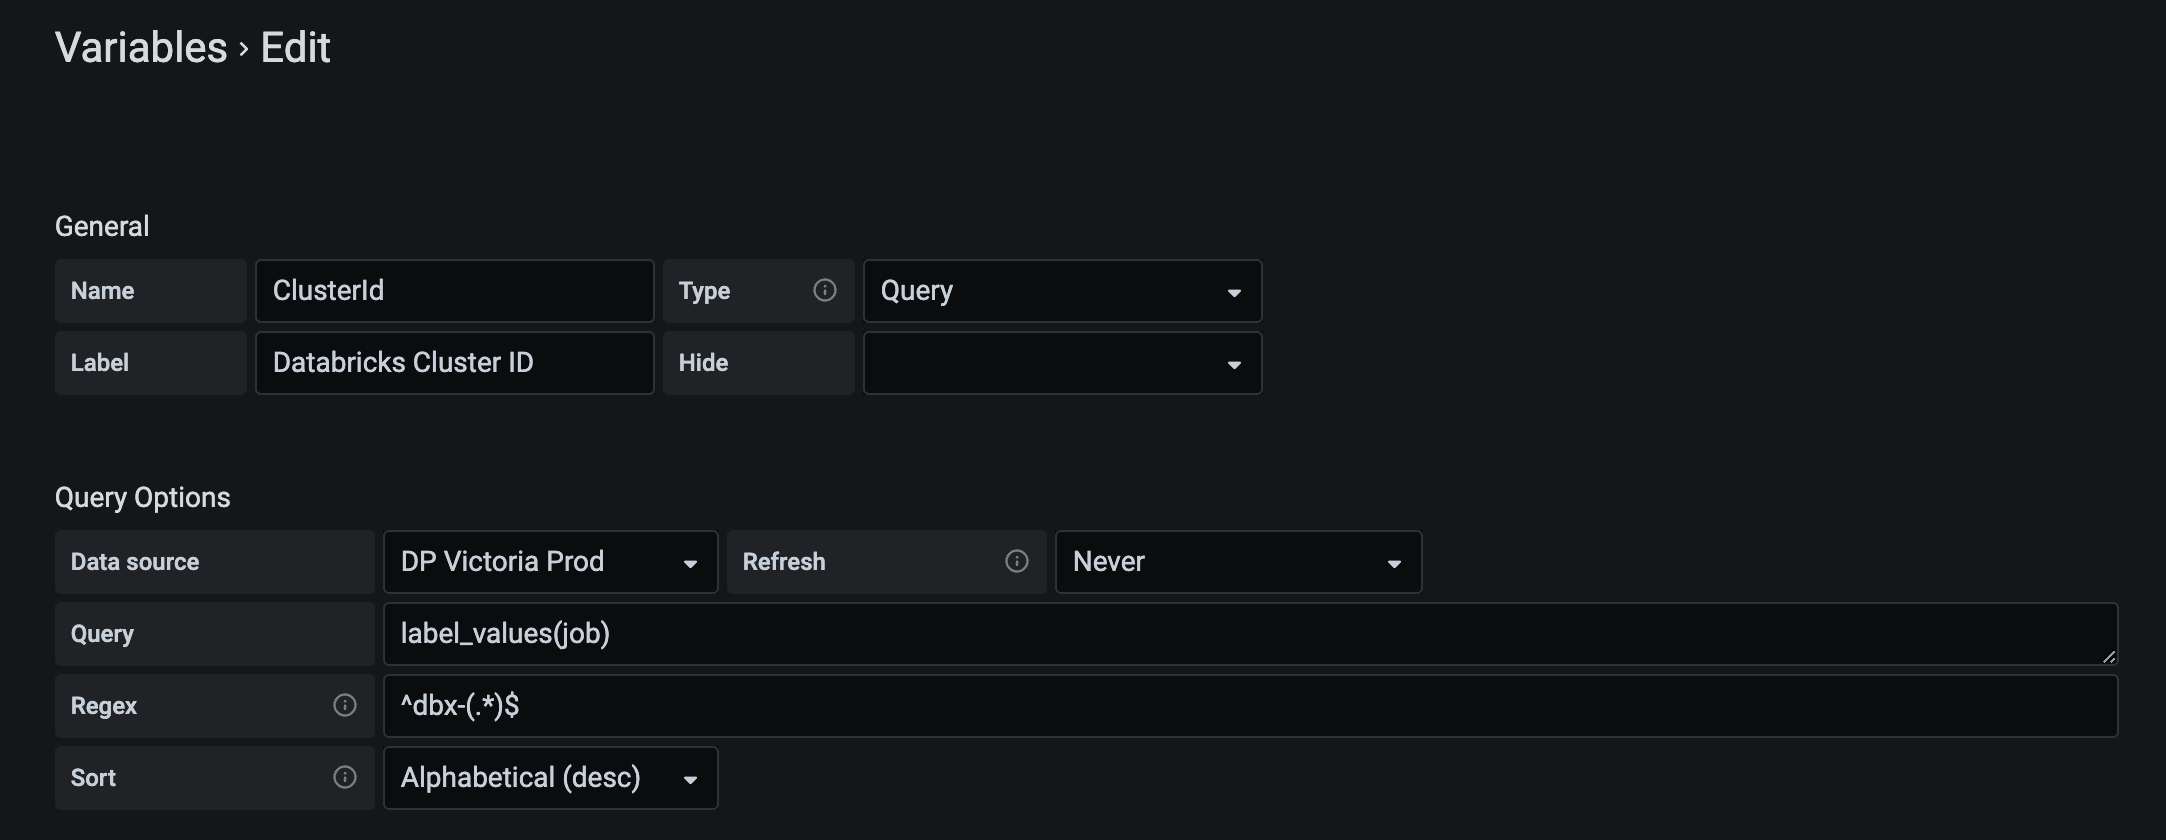
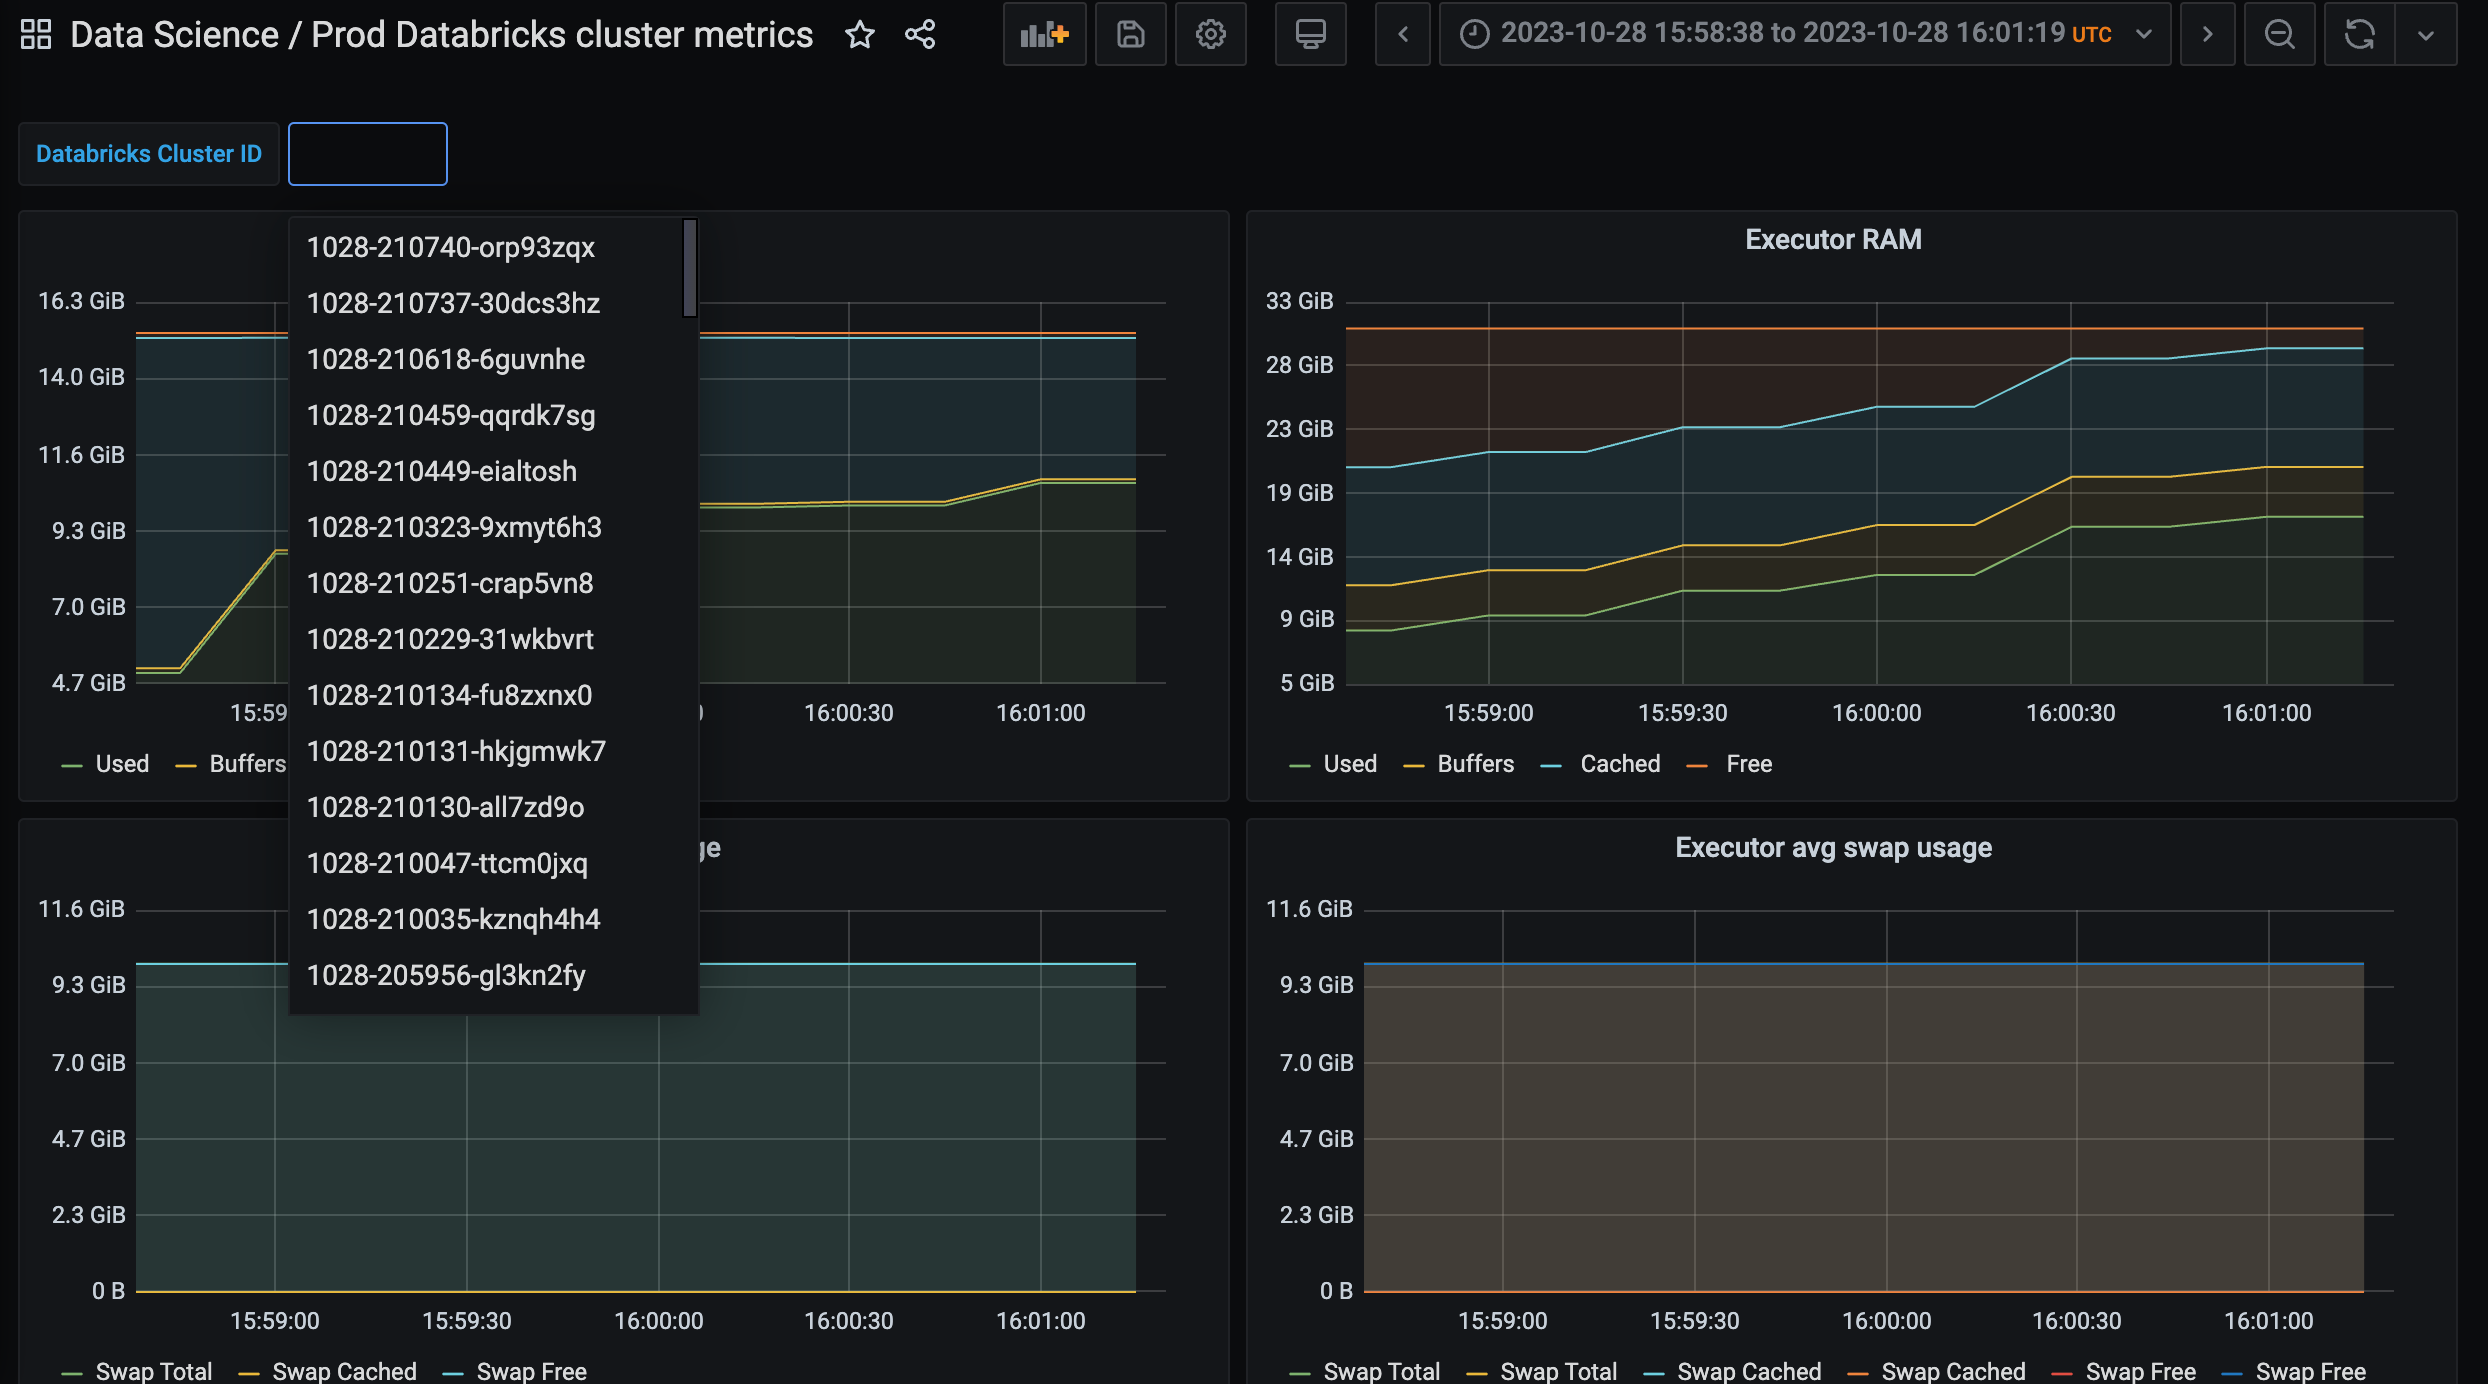
Note that in this setup, you can compose the Grafana link only with a Databricks cluster ID. In the example above, the URL parameter added to the Grafana dashboard URL var-ClusterId=

That way, we provide our users with the ability to monitor performance metrics during or after pipeline execution.
Prometheus alerts
Victoria Metrics is compatible with Alertmanager (look at these docs to set it up). Alertmanager rules can be used to monitor performance and issue alerts. The simplest example is to alert if the execution time for the past day for a given MyPipelineName data pipeline is too high.
- alert: "Too much time executing MyPipelineName"
  expr: max_over_time(max(node_time_seconds{task_family="MyPipelineName"} - node_boot_time_seconds{task_family="MyPipelineName"})[1d]) > 60 * 60
  for: 5m
  labels:
    severity: warning
    oncall_team: data-science
Performance insights
Using Victoria Metrics API, we can export the metrics and run computations on top of it. Here’s an example of how to do it:
# Fetch all job names that have perf data in VM.
resp = r.get(
  'https://vm-url/api/v1/label/job/values',
  params={
    'start': '-1d',
  }).json()
job_names = resp['data']

# Download JSONL files with metrics to local machine.
for job in job_names:
    with r.get('https://vm-url/api/v1/export', params={
        'match[]': f'''{{job="{job}"}}'''
    }, stream=True) as resp, pathlib.Path(f"/dir/{job}.jsonl").open("wb") as f:
        f.write(resp.content)
The imported metrics can be uploaded to any analytical database or data lake. Use SQL to find jobs with undesired performance metric values. Some metrics worth monitoring:
-
Average CPU I/O Wait time
-
Max RAM usage / Total RAM available
-
Swap usage
-
Spikes in total disk capacity (in Databricks, it means storage autoscaling kicked in)
What didn’t work for us
CloudWatch
CloudWatch is a monitoring service provided by Amazon Web Services (AWS). It allows users to view and collect key metrics, logs, set alarms, and automatically react to changes in AWS resources.
We considered sending metrics to CloudWatch but eventually disabled the integration. The main reason was high operational costs.
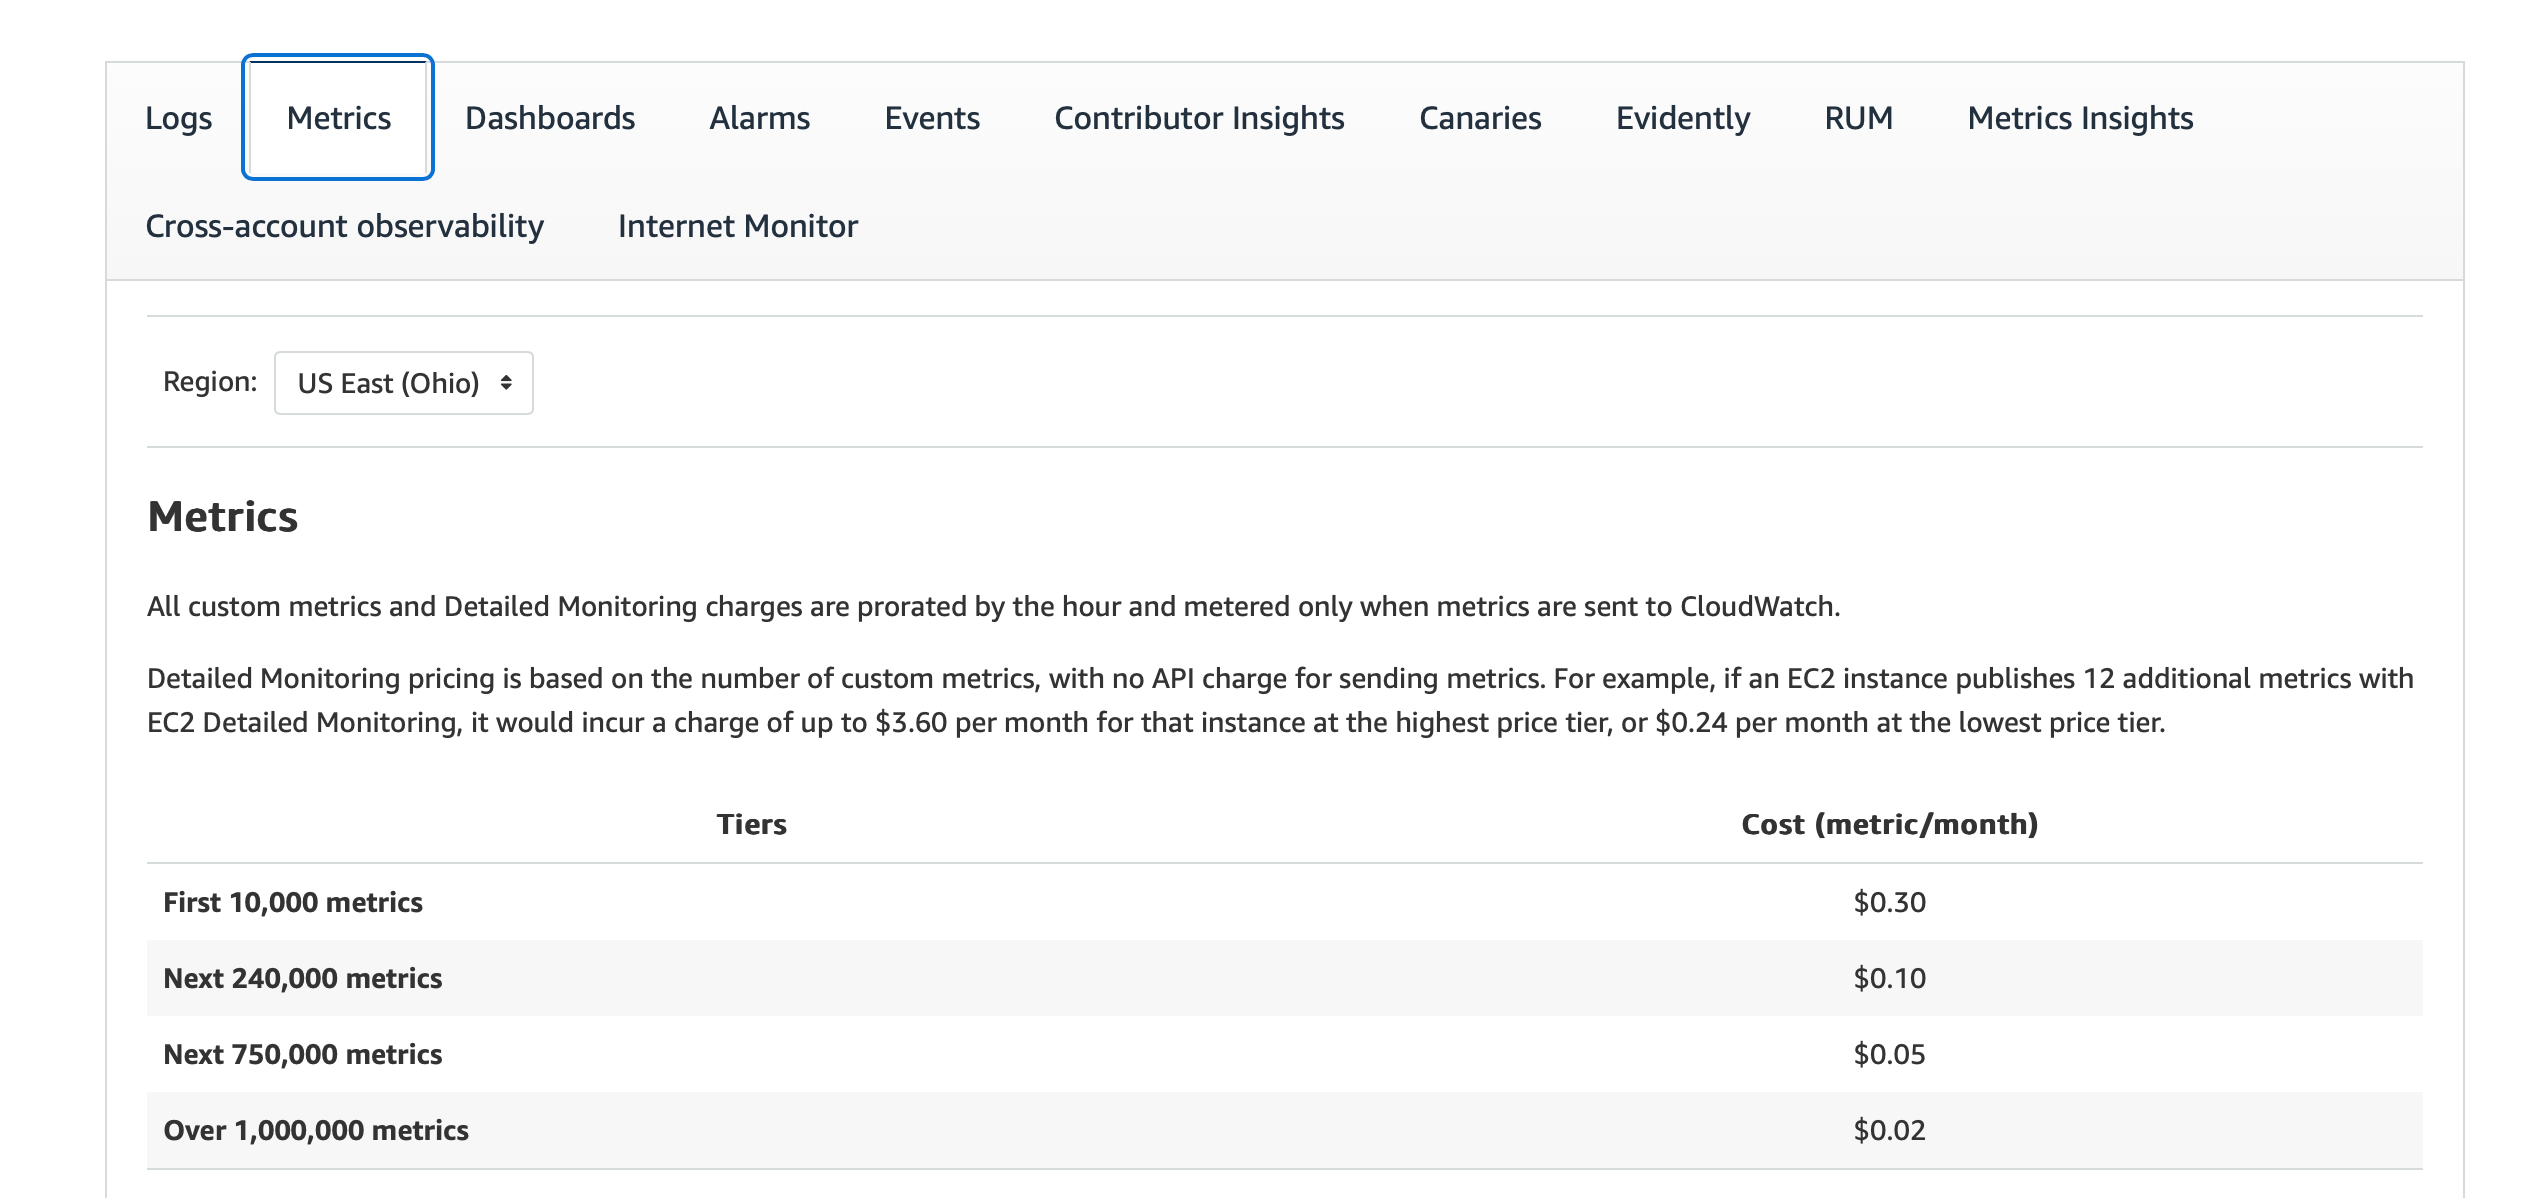
Logging metrics from each Spark driver/executor means extremely high cardinality of metric labels (in the best case, it’s # metrics * # of VM instances run daily). CloudWatch charges based on number of unique metrics, which was simply too high in our case.
Prometheus + Push Gateway
Prometheus alone can’t be used to push metrics to it. Pushgateway is a small go service that can be used to push metrics to it and wait for Prometheus to scrap metrics from it.
We couldn’t use Pushgateway because it doesn’t support TTL for metrics. Due to very high metric cardinality, we needed to clean up Pushgateway manually, which was quite complex to do.
Conclusion
In this article, we discovered the performance monitoring and observability approach of Spark Databricks pipelines. We demonstrated how to send, store, and retrieve metrics from Victoria Metrics and use them for performance alerts and insights generation.